When one variable is assumed to be measured on an interval scale, and another is dichotomous, that is, has only two levels, it is possible to illustrate the relationship between the variables by drawing overlapping frequency distributions. In the data presented in the preceding chapter shoe size could be treated as an interval measure and sex was a dichotomous variable with two levels, male and female. The relationship between sex and shoe size is thus an appropriate candidate for overlapping frequency distributions. Overlapping frequency distributions would be useful for two reasons: males wear different styles of shoes than females, and male and female shoe sizes are measured using different scales.
The first step in drawing overlapping frequency distributions is to partition the measured variable into two subsamples, one for each level of the dichotomous variable. In the example, shoe sizes are grouped into male and female groups as follows:
| Males | 10.5 | 9.5 | 10.5 | 8.5 | 9.5 | 9.0 | ||||
| Females | 6.0 | 8.5 | 7.0 | 7.0 | 6.5 | 7.0 | 7.5 | 6.5 | 7.5 |
A separate frequency table is then computed for each subsample. The example results in the following frequency tables.
| Males | Females | |||
|---|---|---|---|---|
| Shoe Size | Abs Freq | Rel Freq | Abs Freq | Rel Freq |
| 6.0 | 0 | .00 | 1 | .11 |
| 6.5 | 0 | .00 | 2 | .22 |
| 7.0 | 0 | .00 | 3 | .33 |
| 7.5 | 0 | .00 | 2 | .22 |
| 8.0 | 0 | .00 | 0 | .00 |
| 8.5 | 1 | .17 | 1 | .11 |
| 9.0 | 1 | .17 | 0 | .00 |
| 9.5 | 2 | .33 | 0 | .00 |
| 10.0 | 0 | .00 | 0 | .00 |
| 10.5 | 2 | .33 | 0 | .00 |
| 6 | 1.00 | 9 | .99 | |
Note that the relative frequency is computed by dividing the absolute frequency by the number of scores in that group. For example, the relative frequency of shoe size 9.5 for males is 2, the number of males wearing a size 9.5 shoe, divided by 6, the total number of males. The sum of the relative frequency for each gender must equal 1.00, within rounding error. In this case, by rounding the relative frequencies to two decimal places, the sum of the relative frequencies will most likely be between .98 and 1.02. Any sum outside this range is most likely due to an error in computation and not rounding error.
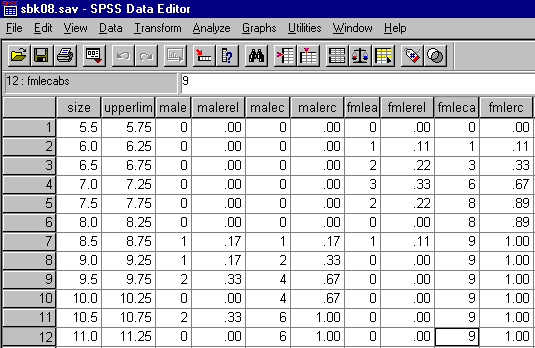
To draw overlapping relative frequency polygons using SPSS/WIN enter the relative frequency table as data. The example appears below:
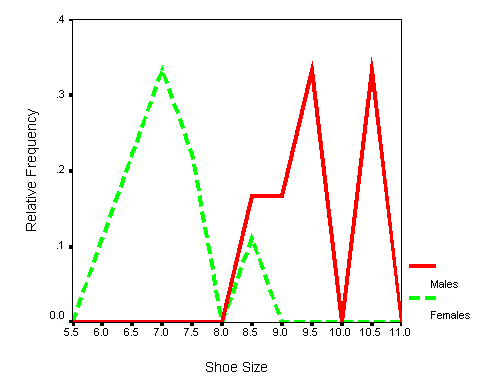
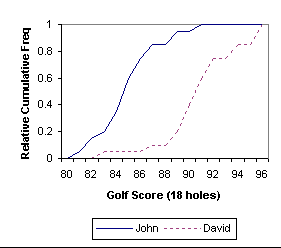
The overlapping relative frequency polygons are simply the two polygons for each group drawn on the same set of axes, distinguished with different types of lines. If conflicts appear, they may be resolved by drawing the lines next to one another. An example of overlapping relative frequency polygons is presented below.
When polygons are drawn in this form, they may be easily compared with respect to their centers, shapes, continuity, etc.
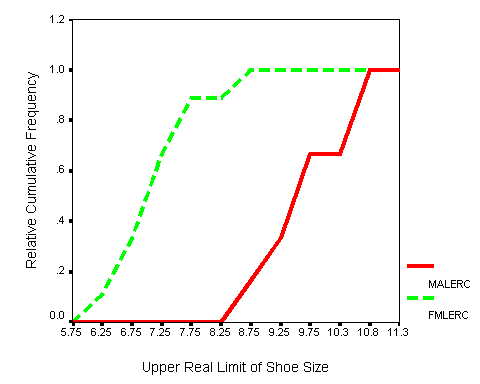
Overlapping relative cumulative frequency polygons may also give additional information about how two distributions are similar or different. In many ways the overlapping cumulative frequency polygons are easier to interpret because the lines do not jump up and down as much as in the non-cumulative polygons.
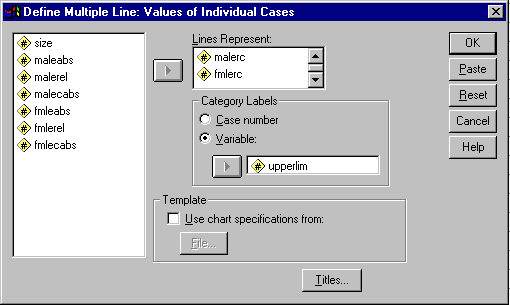
The procedure to construct the preceding graphs in SPSS is to first the enter a frequency table as described above and then select the Graphs/Line/Multiple options from the toolbar. A multi-line graph will generate the desired results. The commands necessary to generate the overlapping relative cumulative frequency polygons are illustrated below:
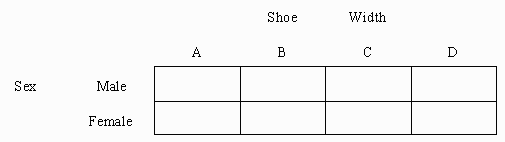
Frequency tables of two variables presented simultaneously are called contingency tables. Although this rule is sometimes broken, contingency tables are generally appropriate for variables that have five or fewer levels, or different values. More than five levels, while not technologically incorrect, may result in tables that are very difficult to read and should be used with caution.
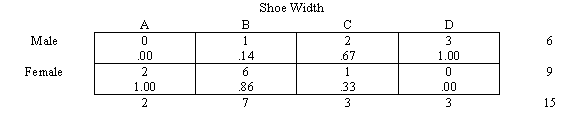
Contingency tables are constructed by listing all the levels of one variable as rows in a table and the levels of the other variables as columns. For example, the labeling of the contingency table of sex by shoe width is presented below.
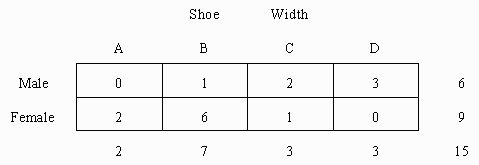
The second step in computing the contingency table is to find the joint or cell frequency for each cell. For example, the cell in the upper left corner contains the number of males who had shoe width of "A", which in this case is zero. In turn, each cell has its frequency counted and placed in the appropriate cell. The cell frequencies are then summed across both the rows and the columns. The sums are placed in the margins, the values of which are called marginal frequencies. The lower right hand corner value contains the sum of either the row or column marginal frequencies, which both of which must be equal to N. An example is presented below.
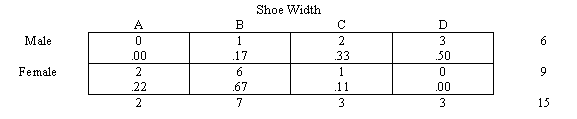
The above is an absolute frequency table and may be converted to a relative frequency table by dividing the absolute cell frequency by the number of scores, which may be row marginal frequencies, column marginal frequencies, or overall marginal frequency (N). In the case of the above example, computing relative frequencies with respect to the row marginal frequencies results in the following table. This table gives the proportion of males or females who have a given shoe width, and would probably be most useful in ordering shoes.
Computing the cell proportions using the column marginal frequencies, expressing the proportion of each shoe width which was male or female, is probably not as useful, but is shown below as a second possibility.
Contingency tables are a convenient means of showing the relationship between two variables. When relative frequencies are computed, useful information about the distribution of a single variable over levels of another variable may be presented.