The steps in the analysis of the data include: 1.) the mechanics of organizing the data, 2.) creating computer data files, and 3.) performing both the initial and more detailed analysis.
These steps are covered in other documents and YouTube videos including:
The first step in the analysis of the data is organizing the collected numbers. A most convenient manner of doing this is by the use of a table or DATA MATRIX. A matrix is nothing more than a table, that is, a sheet of paper with a certain number of columns ruled off and a certain number of rows, such as in the example which follows:
Each square is an element of the matrix and corresponds to a single number, such as grade point average or number of automobiles owned. These are the numbers that have been collected in the preceding stage of the project.
In general, each row of the data matrix corresponds to a record, which in many cases is an individual. Each column, on the other hand, represents a variable or a measure. The data matrix, therefore, takes on the following form:
| Column 1 | Column 2 | Column 3 | Column 4 | |
| Row 1 | ||||
| Row 2 | ||||
| Row 3 |
| Variable 1 | Variable 2 | Variable 3 | Variable 4 | |
| Record 1 | ||||
| Record 2 | ||||
| Record 3 |
All of the information collected in the study may be represented in a data matrix like the preceding example. After collecting data from twenty subjects using the data collection instrument presented in Figure 1-3, the data could be transferred from the questionnaires to the data matrix by copying each variable in the correct position for each subject. An example data matrix is presented below. This example has K=11 columns (variables) and N=20 rows (subjects). This would describe a 20 x 11 matrix containing 220 entries, or eleven entries for each of twenty subjects.
| Subject | Age | Gender | Rank | Support | Appren | Ward | Client | Curr | Faculty | Budget |
| 1 | 20 | 0 | 5 | 4 | 3 | 3 | 3 | 1 | 2 | 4 |
| 2 | 17 | 0 | 2 | 3 | 1 | 1 | 3 | 2 | 4 | 5 |
| 3 | 17 | 1 | 3 | 4 | 4 | 1 | 3 | 2 | 1 | 2 |
| 4 | 22 | 0 | 1 | 2 | 5 | 1 | 4 | 5 | 2 | 3 |
| 5 | 17 | 1 | 4 | 2 | 5 | 4 | 4 | 3 | 2 | 5 |
| 6 | 16 | 0 | 4 | 3 | 1 | 2 | 3 | 2 | 1 | 1 |
| 7 | 16 | 0 | 4 | 2 | 3 | 2 | 3 | 2 | 4 | 4 |
| 8 | 19 | 0 | 1 | 3 | 3 | 4 | 1 | 4 | 1 | |
| 9 | 16 | 1 | 4 | 2 | 1 | 3 | 2 | 1 | 2 | 5 |
| 10 | 1 | 3 | 2 | 2 | 3 | 4 | 3 | 3 | 2 | |
| 11 | 18 | 1 | 3 | 3 | 2 | 2 | 2 | 3 | 1 | 4 |
| 12 | 17 | 0 | 5 | 3 | 2 | 1 | 3 | 3 | 1 | 3 |
| 13 | 22 | 1 | 2 | 3 | 1 | 4 | 3 | 3 | 1 | 4 |
| 14 | 22 | 1 | 2 | 4 | 3 | 1 | 4 | 3 | 1 | 3 |
| 15 | 1 | 5 | 1 | 2 | 2 | 2 | 3 | 1 | 5 | |
| 16 | 22 | 0 | 3 | 2 | 2 | 2 | 2 | 2 | 1 | 1 |
| 17 | 21 | 0 | 3 | 3 | 1 | 3 | 2 | 1 | 2 | 4 |
| 18 | 20 | 1 | 2 | 1 | 3 | 1 | 3 | 2 | 5 | 3 |
| 19 | 20 | 1 | 3 | 3 | 3 | 1 | 2 | 3 | 1 | 2 |
| 20 | 16 | 0 | 4 | 1 | 2 | 3 | 2 | 3 |
Almost all computer packages store information internally in much the same fashion as the data matrix. That is, a table of numbers is stored in memory with the columns corresponding to variables and the rows corresponding to individuals. The columns will be referenced by variable names. The problem becomes how to get the information from the data matrix on paper into computer memory.
At this point a very practical question of what kind of data to put into memory may be asked. Should the data be transformed to standard scores? Should all the data be used or only part of it? In general, the computer is an excellent data manipulation device and can perform almost any transformation faster and more accurately than any human can do it. It therefore makes sense that the most detailed raw data should be entered in the initial data matrix and later transformed within the computer program to more useable information. Thus, instead of entering miles per gallon, the knowledgeable computer user will enter the number of miles driven and the number of gallons of gasoline used. Although this requires an additional variable, it reduces the amount of computation which must be performed before placing the data on computer files and allows the user to analyze two additional variables if it should be desired to do so later in the study.
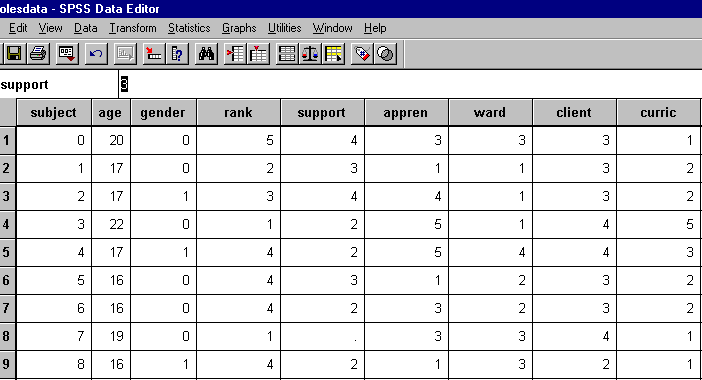
Load the SPSS program, enter the data in the data editor, and document the data file with variable labels and value labels. The data file should look something like the following:
The Roles Data File in the SPSS Data Editor
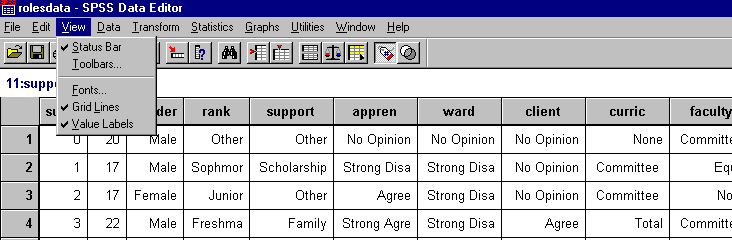
Clicking on the "View" command on the toolbar, followed by the "Value Labels" option will change the view of the data to the following:
Viewing Value Labels in the SPSS Data Editor
Completion of the homework assignment using SPSS can be accomplished with the following commands.
By clicking on "Statistics" and selecting the options "Correlate" and then "Bivariate" the following screen should appear:
SPSS Commands to Find a Correlation Matrix
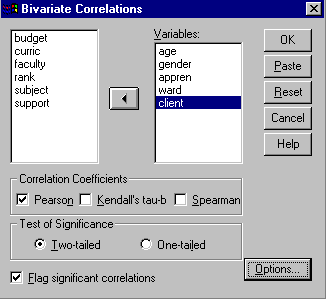
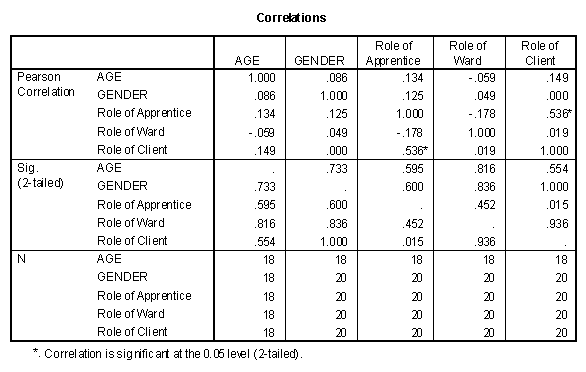
Mark the five variables to be included in the correlation matrix and send them to the right-hand box as demonstrated in the figure above. Click "OK" and the output editor should appear with the following table:
SPSS Correlation Command Output
To find the contingency table, click "Statistics", followed by "Summarize" and "Crosstabs." The following options should appear:
SPSS Commands to Find Contingency Tables
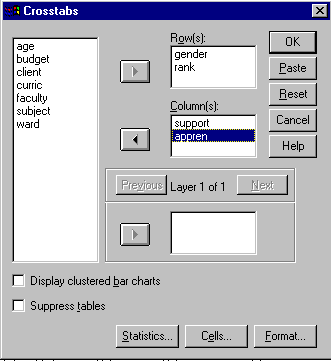
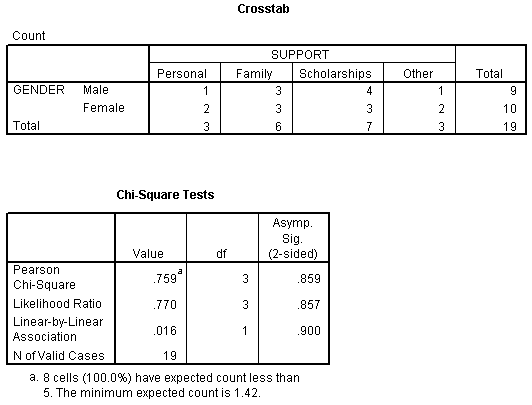
Mark and click the appropriate variables to the "Row(s)" and "Column(s)" boxes. Click on the "Statistics" button followed by checking the "Chi-square" option to generate a commonly used statistics. The output from these commands will be seen as follows:
This is the contingency table and Chi-square statistic for the Gender by Support variables. There will be three other similar pairs of tables.
SPSS Contingency Table and Chi-square Output
These statistics are found by clicking on "Statistics", followed by "Compare Means", and then "Means". The interface should appear as follows:
SPSS Commands to Find Breakdown Tables
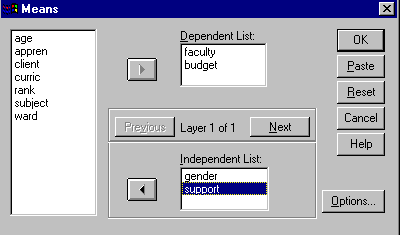
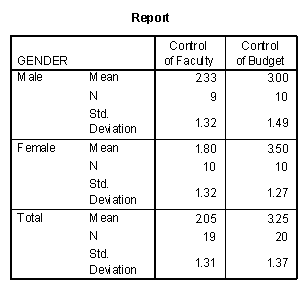
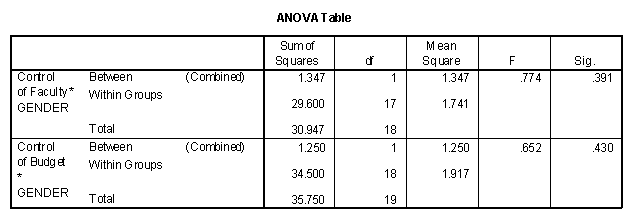
Clicking on "Options" and then checking "Anova table and eta" will provide an hypothesis test about your means. The output for the "Faculty" by "Gender" variables will be as follows:
SPSS Breakdown Table Means Output
SPSS Breakdown Table ANOVA Output
Three more similar tables will be generated by using this sequence of commands.